Python, MatPlotLib, and Numpy
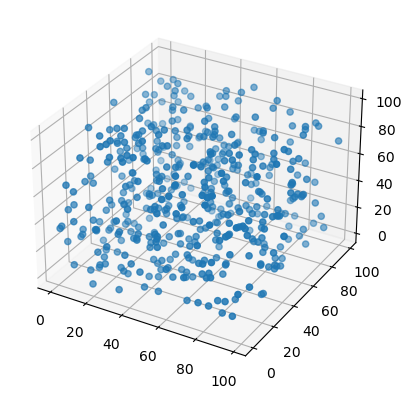
The provided Python code utilizes the NumPy and Matplotlib libraries to create a three-dimensional scatter plot. Here's a breakdown of the code:
1. Importing libraries:
- `import numpy as np`: Imports the NumPy library and assigns it the alias "np".
- `import matplotlib.pyplot as plt`: Imports the pyplot module from the Matplotlib library and assigns it the alias "plt".
- `from mpl_toolkits import mplot3d`: Imports the mplot3d toolkit from Matplotlib, which provides 3D plotting capabilities.
2. Setting up the plot:
- `ax = plt.axes(projection="3d")`: Creates a 3D plot axes object.
3. Generating random data:
- `x_data = np.random.randint(0,100,500,)`: Generates an array of 500 random integers between 0 and 100 and assigns it to the variable "x_data".
- `y_data = np.random.randint(0,100,500,)`: Generates an array of 500 random integers between 0 and 100 and assigns it to the variable "y_data".
- `z_data = np.random.randint(0,100,500,)`: Generates an array of 500 random integers between 0 and 100 and assigns it to the variable "z_data".
4. Creating the scatter plot:
- `ax.scatter(x_data, y_data, z_data)`: Plots the data points in a 3D scatter plot, where the x-coordinates are given by "x_data", y-coordinates by "y_data", and z-coordinates by "z_data".
5. Displaying the plot:
- `plt.show()`: Shows the 3D scatter plot on the screen.